Details for RGI subregions
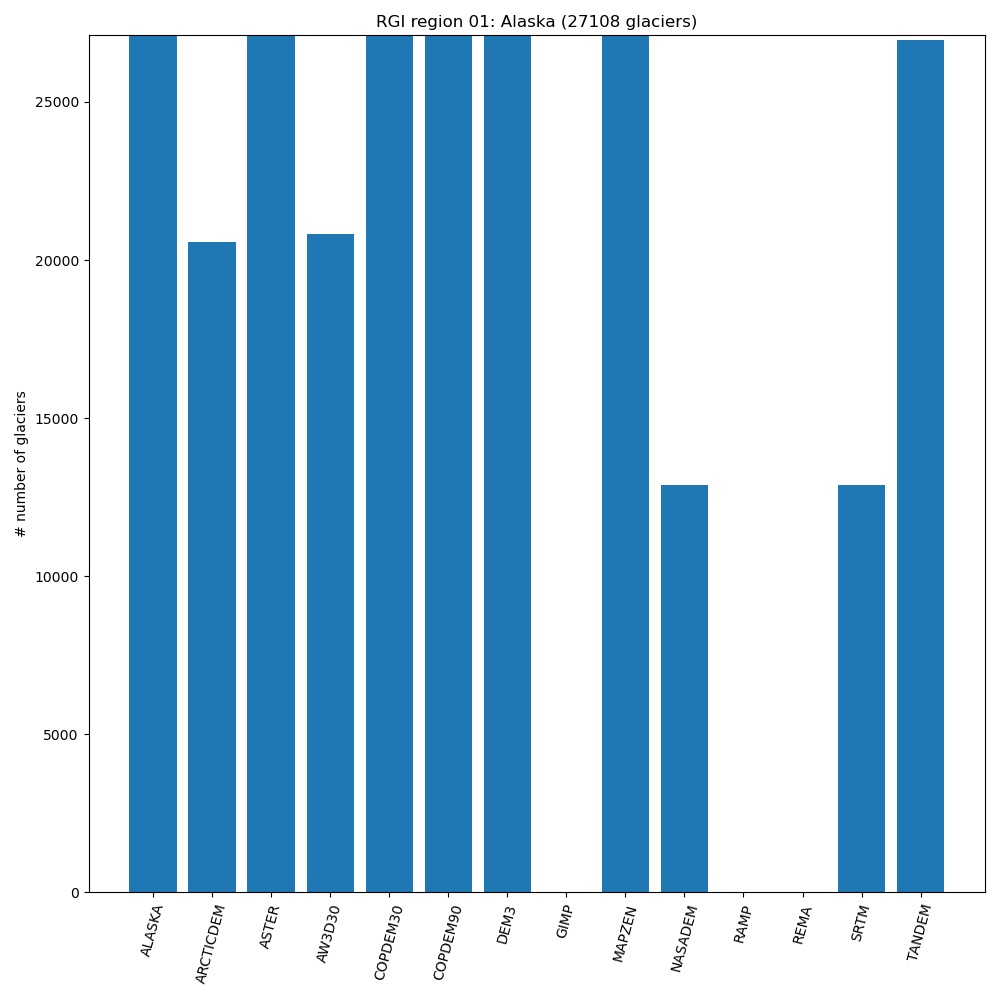
01 - Alaska
RGI region |
# total |
ALASKA |
ARCTICDEM |
ASTER |
AW3D30 |
COPDEM30 |
COPDEM90 |
DEM3 |
GIMP |
MAPZEN |
NASADEM |
RAMP |
REMA |
SRTM |
TANDEM |
01-01: N Alaska |
616 |
100% |
94% |
100% |
81% |
100% |
100% |
100% |
– |
100% |
– |
– |
– |
– |
100% |
01-02: Alaska Ra (Wrangell/Kilbuck) |
5773 |
100% |
81% |
100% |
67% |
100% |
100% |
100% |
– |
100% |
2% |
– |
– |
2% |
99% |
01-03: Alaska Pena (Aleutians) |
872 |
100% |
87% |
100% |
100% |
100% |
100% |
100% |
– |
100% |
100% |
– |
– |
100% |
100% |
01-04: W Chugach Mtns (Talkeetna) |
4258 |
100% |
90% |
100% |
54% |
100% |
100% |
100% |
– |
100% |
10% |
– |
– |
10% |
100% |
01-05: St Elias Mtns |
5037 |
100% |
86% |
100% |
54% |
100% |
100% |
100% |
– |
100% |
19% |
– |
– |
19% |
100% |
01-06: N Coast Ranges |
10552 |
100% |
59% |
100% |
99% |
100% |
100% |
100% |
– |
100% |
98% |
– |
– |
98% |
98% |
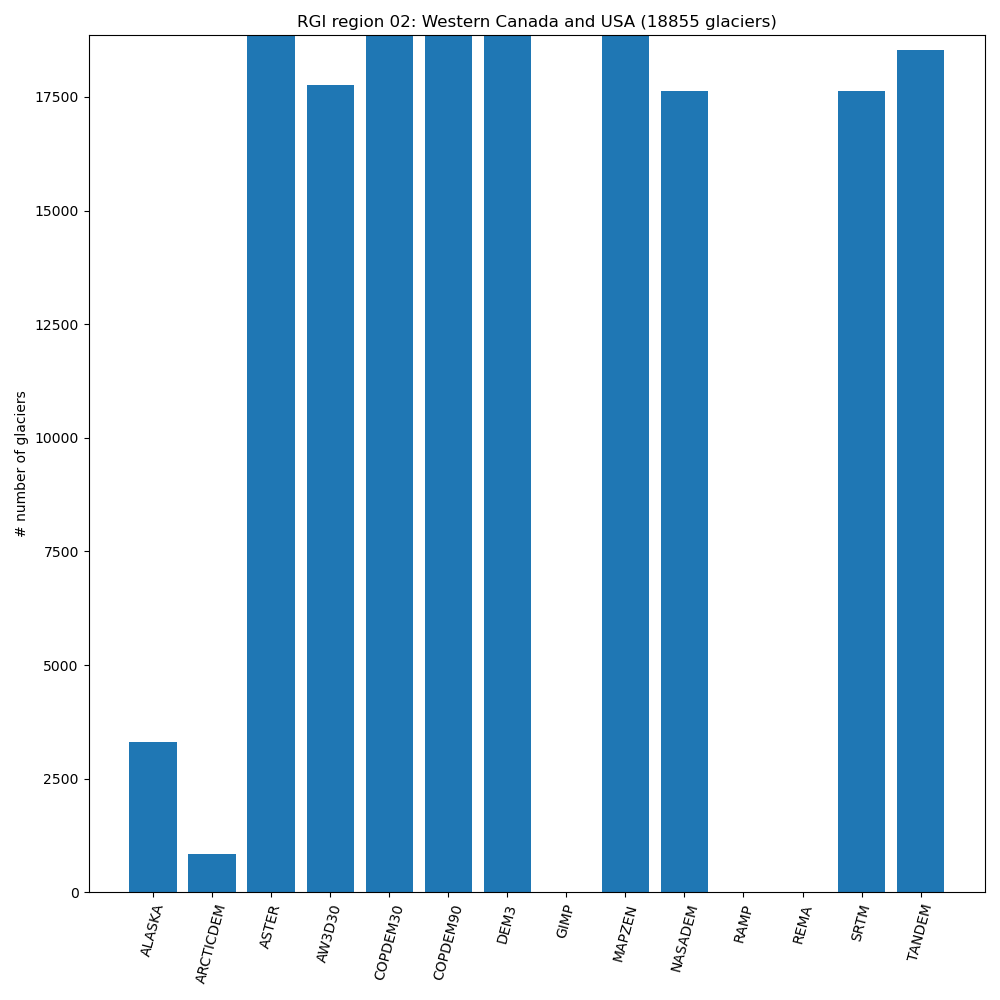
02 - Western Canada and USA
RGI region |
# total |
ALASKA |
ARCTICDEM |
ASTER |
AW3D30 |
COPDEM30 |
COPDEM90 |
DEM3 |
GIMP |
MAPZEN |
NASADEM |
RAMP |
REMA |
SRTM |
TANDEM |
02-01: Mackenzie and Selwyn Mtns |
1235 |
– |
68% |
100% |
10% |
100% |
100% |
100% |
– |
100% |
– |
– |
– |
– |
100% |
02-02: S Coast Ranges |
7389 |
35% |
– |
100% |
100% |
100% |
100% |
100% |
– |
100% |
100% |
– |
– |
100% |
96% |
02-03: N Rocky Mtns |
5067 |
13% |
– |
100% |
100% |
100% |
100% |
100% |
– |
100% |
100% |
– |
– |
100% |
98% |
02-04: Cascade Ra and Sa Nevada |
3202 |
– |
– |
100% |
100% |
100% |
100% |
100% |
– |
100% |
100% |
– |
– |
100% |
99% |
02-05: S Rocky Mtns |
1962 |
– |
– |
100% |
100% |
100% |
100% |
100% |
– |
100% |
100% |
– |
– |
100% |
100% |
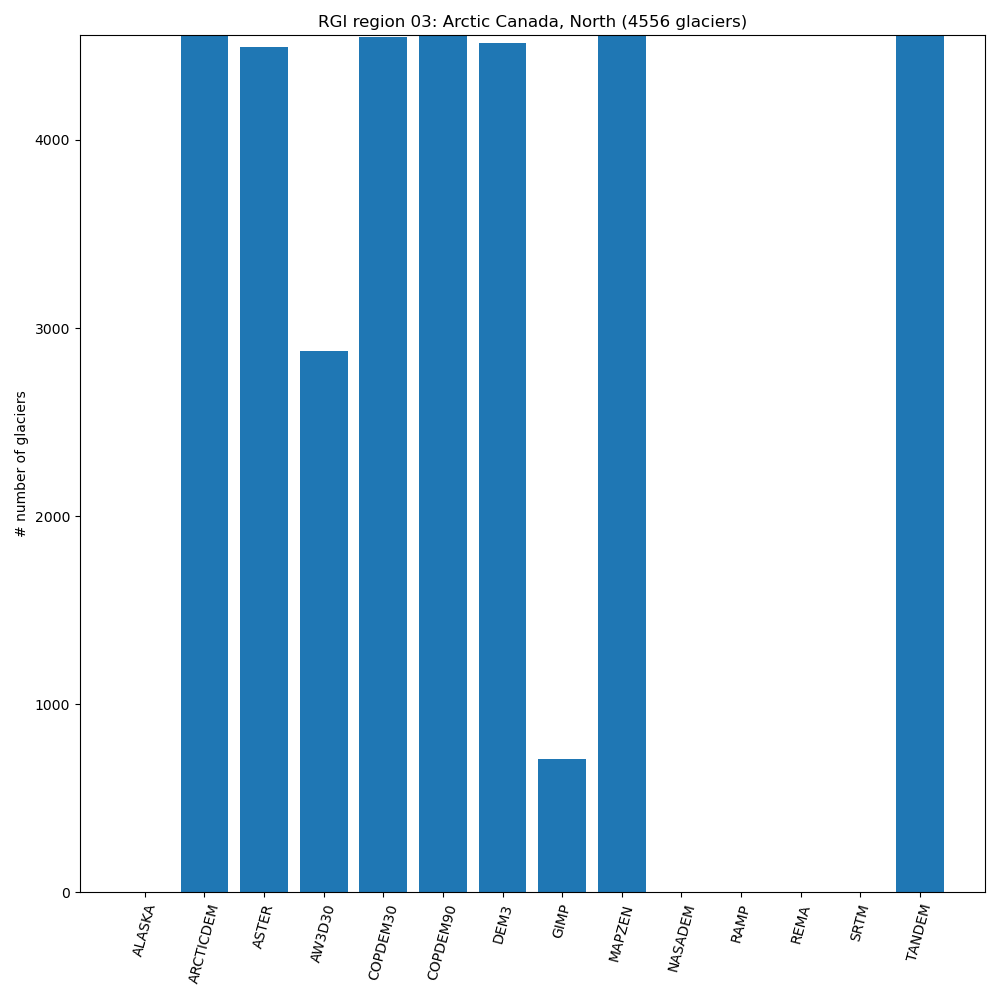
03 - Arctic Canada, North
RGI region |
# total |
ALASKA |
ARCTICDEM |
ASTER |
AW3D30 |
COPDEM30 |
COPDEM90 |
DEM3 |
GIMP |
MAPZEN |
NASADEM |
RAMP |
REMA |
SRTM |
TANDEM |
03-01: N Ellesmere Island |
2049 |
– |
99% |
96% |
44% |
99% |
99% |
98% |
15% |
100% |
– |
– |
– |
– |
100% |
03-02: Axel Heiberg and Meighen Is |
627 |
– |
100% |
100% |
63% |
100% |
100% |
100% |
– |
100% |
– |
– |
– |
– |
100% |
03-03: NC Ellesmere Island |
880 |
– |
100% |
100% |
96% |
100% |
100% |
99% |
41% |
100% |
– |
– |
– |
– |
100% |
03-04: SC Ellesmere Island |
241 |
– |
100% |
100% |
72% |
100% |
100% |
100% |
8% |
100% |
– |
– |
– |
– |
100% |
03-05: S Ellesmere Island (NW Devon) |
536 |
– |
100% |
100% |
74% |
100% |
100% |
100% |
– |
100% |
– |
– |
– |
– |
100% |
03-06: Devon Island |
216 |
– |
100% |
100% |
62% |
100% |
100% |
100% |
– |
100% |
– |
– |
– |
– |
100% |
03-07: Melville Island |
7 |
– |
100% |
100% |
57% |
100% |
100% |
100% |
– |
100% |
– |
– |
– |
– |
100% |
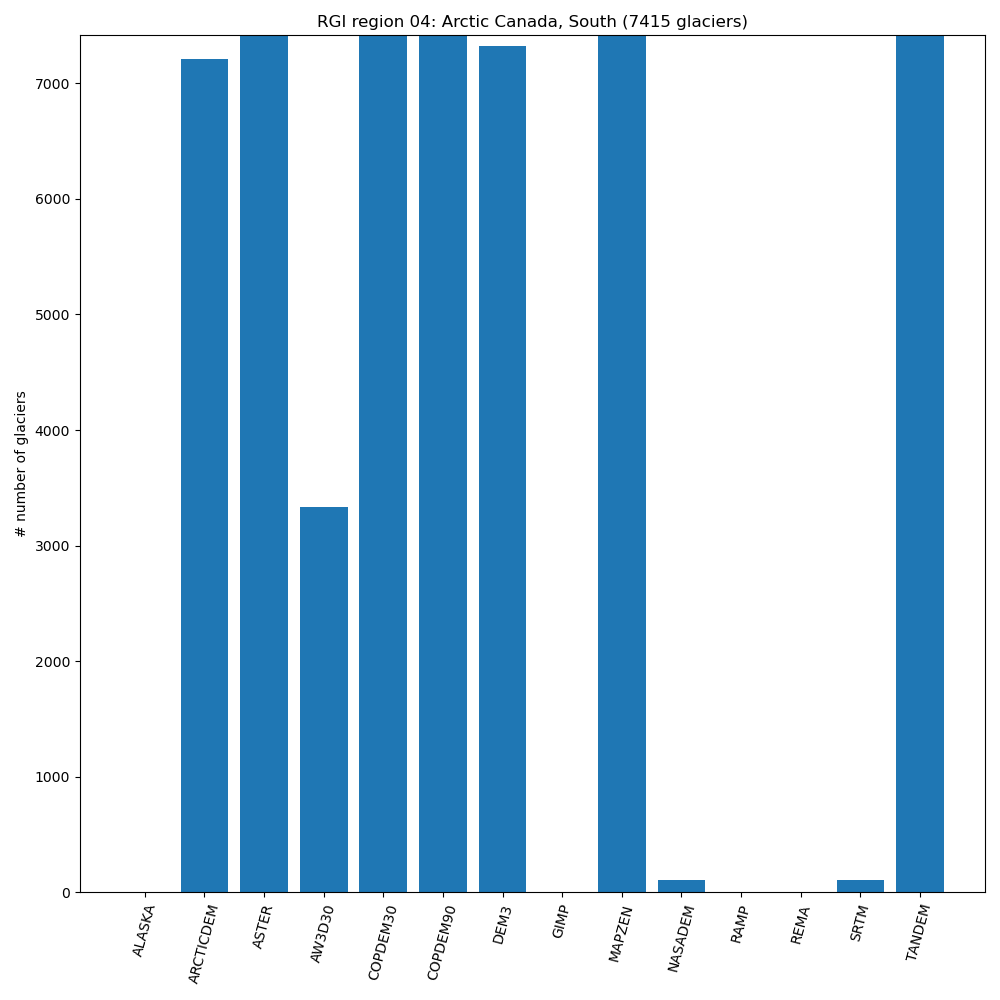
04 - Arctic Canada, South
RGI region |
# total |
ALASKA |
ARCTICDEM |
ASTER |
AW3D30 |
COPDEM30 |
COPDEM90 |
DEM3 |
GIMP |
MAPZEN |
NASADEM |
RAMP |
REMA |
SRTM |
TANDEM |
04-01: Bylot Island |
455 |
– |
99% |
100% |
68% |
100% |
100% |
100% |
– |
100% |
– |
– |
– |
– |
100% |
04-02: W Baffin Island |
71 |
– |
100% |
100% |
63% |
100% |
100% |
100% |
– |
100% |
– |
– |
– |
– |
100% |
04-03: N Baffin Island |
277 |
– |
99% |
100% |
73% |
100% |
100% |
100% |
– |
100% |
– |
– |
– |
– |
100% |
04-04: NE Baffin Island |
1442 |
– |
98% |
100% |
47% |
100% |
100% |
100% |
– |
100% |
– |
– |
– |
– |
100% |
04-05: EC Baffin Island |
1645 |
– |
97% |
100% |
35% |
100% |
100% |
100% |
– |
100% |
– |
– |
– |
– |
100% |
04-06: SE Baffin Island |
2249 |
– |
98% |
100% |
42% |
100% |
100% |
95% |
– |
100% |
– |
– |
– |
– |
100% |
04-07: Cumberland Sound |
1108 |
– |
99% |
100% |
36% |
100% |
100% |
100% |
– |
100% |
– |
– |
– |
– |
100% |
04-08: Frobisher Bay |
65 |
– |
100% |
100% |
66% |
100% |
100% |
100% |
– |
100% |
– |
– |
– |
– |
100% |
04-09: Labrador |
103 |
– |
– |
100% |
100% |
100% |
100% |
100% |
– |
100% |
100% |
– |
– |
100% |
100% |
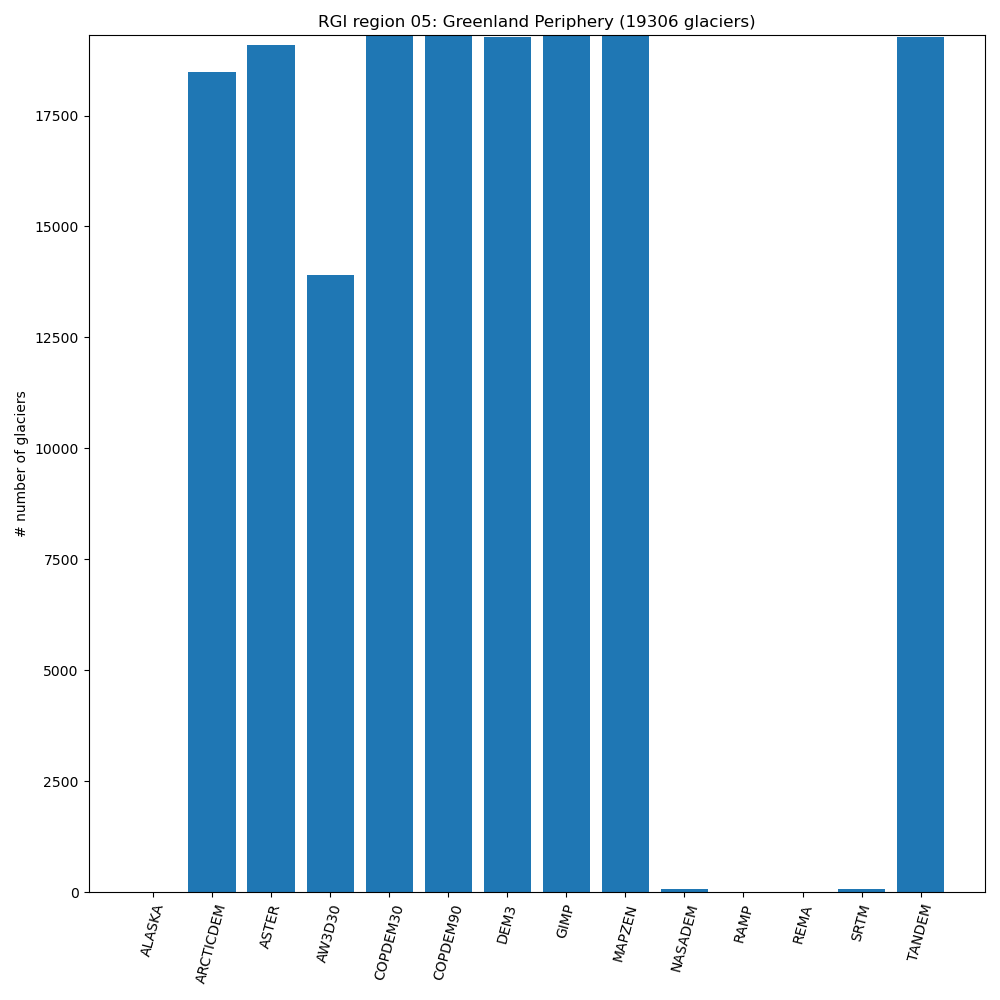
05 - Greenland Periphery
RGI region |
# total |
ALASKA |
ARCTICDEM |
ASTER |
AW3D30 |
COPDEM30 |
COPDEM90 |
DEM3 |
GIMP |
MAPZEN |
NASADEM |
RAMP |
REMA |
SRTM |
TANDEM |
05-01: Greenland Periphery |
19306 |
– |
95% |
98% |
71% |
99% |
99% |
99% |
100% |
99% |
– |
– |
– |
– |
99% |
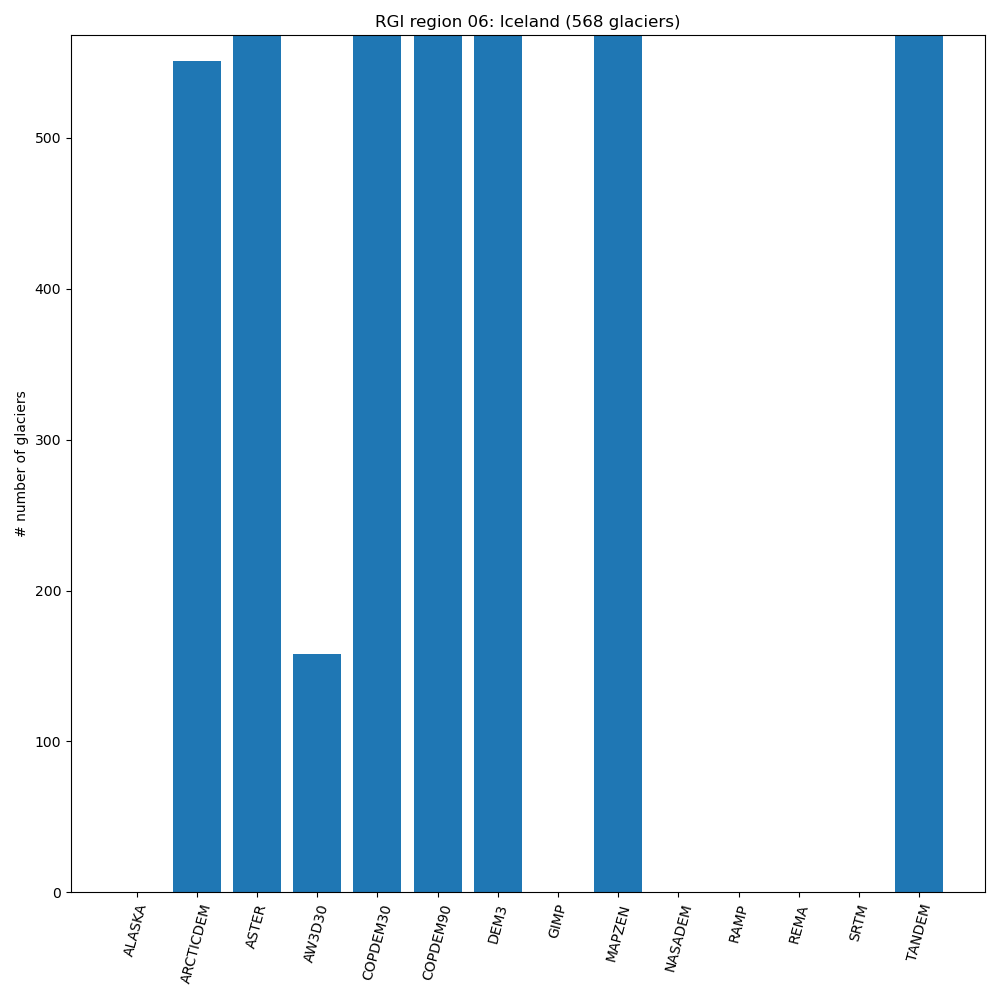
06 - Iceland
RGI region |
# total |
ALASKA |
ARCTICDEM |
ASTER |
AW3D30 |
COPDEM30 |
COPDEM90 |
DEM3 |
GIMP |
MAPZEN |
NASADEM |
RAMP |
REMA |
SRTM |
TANDEM |
06-01: Iceland |
568 |
– |
97% |
100% |
27% |
100% |
100% |
100% |
– |
100% |
– |
– |
– |
– |
100% |
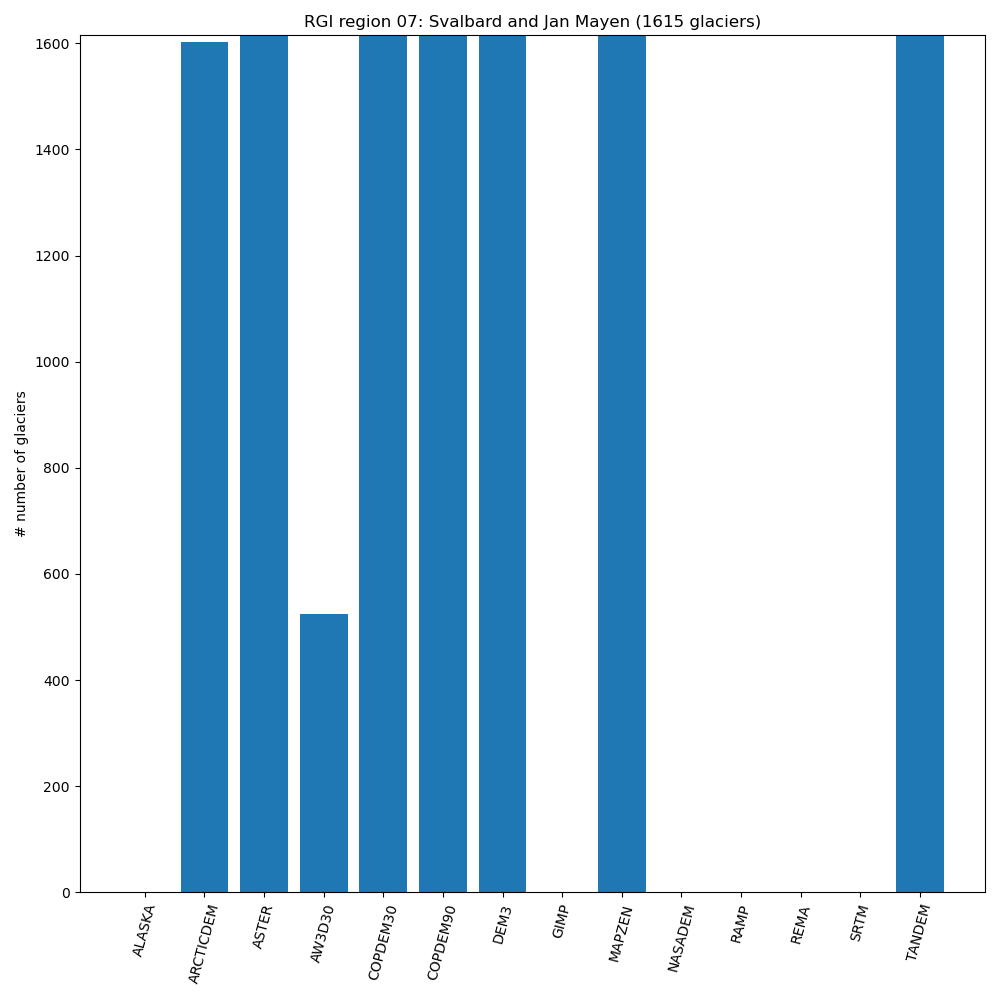
07 - Svalbard and Jan Mayen
RGI region |
# total |
ALASKA |
ARCTICDEM |
ASTER |
AW3D30 |
COPDEM30 |
COPDEM90 |
DEM3 |
GIMP |
MAPZEN |
NASADEM |
RAMP |
REMA |
SRTM |
TANDEM |
07-01: Svalbard |
1567 |
– |
99% |
100% |
33% |
100% |
100% |
100% |
– |
100% |
– |
– |
– |
– |
99% |
07-02: Jan Mayen |
48 |
– |
100% |
100% |
– |
100% |
100% |
100% |
– |
100% |
– |
– |
– |
– |
100% |
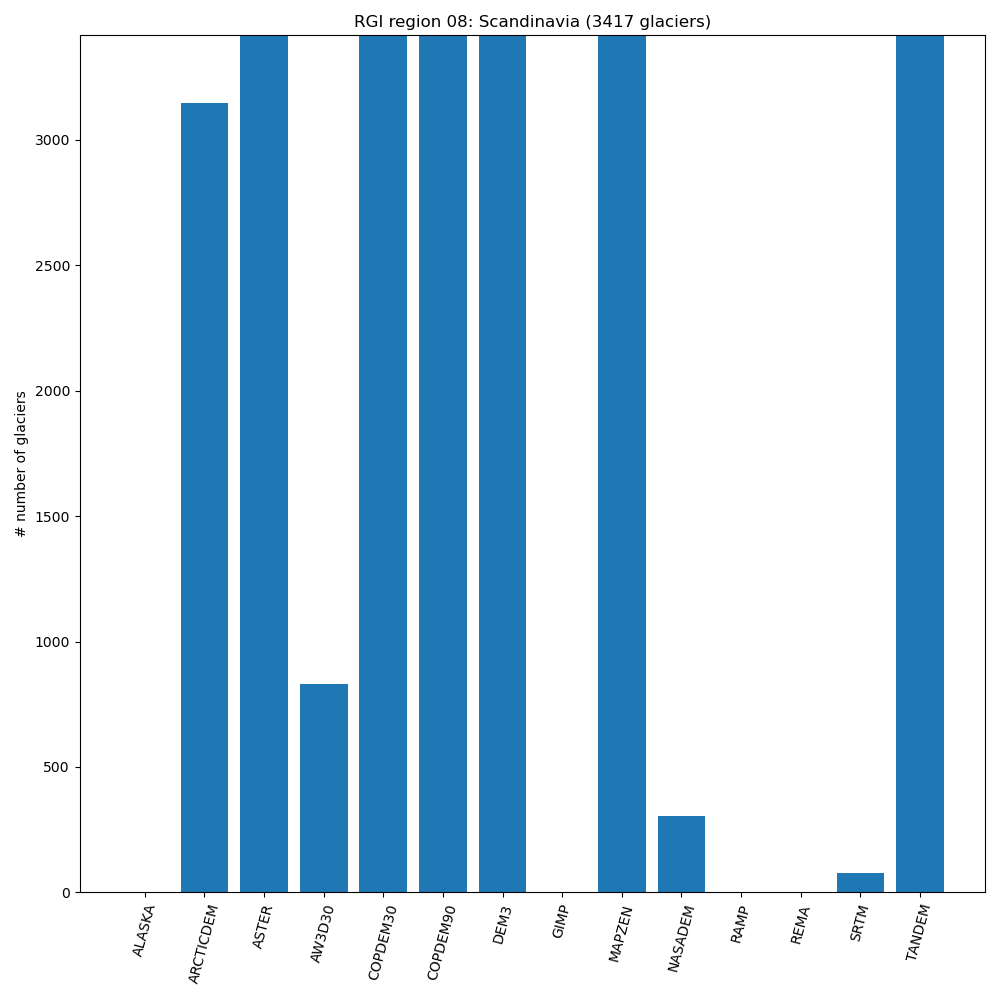
08 - Scandinavia
RGI region |
# total |
ALASKA |
ARCTICDEM |
ASTER |
AW3D30 |
COPDEM30 |
COPDEM90 |
DEM3 |
GIMP |
MAPZEN |
NASADEM |
RAMP |
REMA |
SRTM |
TANDEM |
08-01: N Scandinavia |
1837 |
– |
95% |
100% |
31% |
100% |
100% |
100% |
– |
100% |
– |
– |
– |
– |
100% |
08-02: SW Scandinavia |
1215 |
– |
88% |
100% |
14% |
100% |
100% |
100% |
– |
100% |
18% |
– |
– |
3% |
100% |
08-03: SE Scandinavia |
365 |
– |
84% |
100% |
19% |
100% |
100% |
100% |
– |
100% |
23% |
– |
– |
8% |
100% |
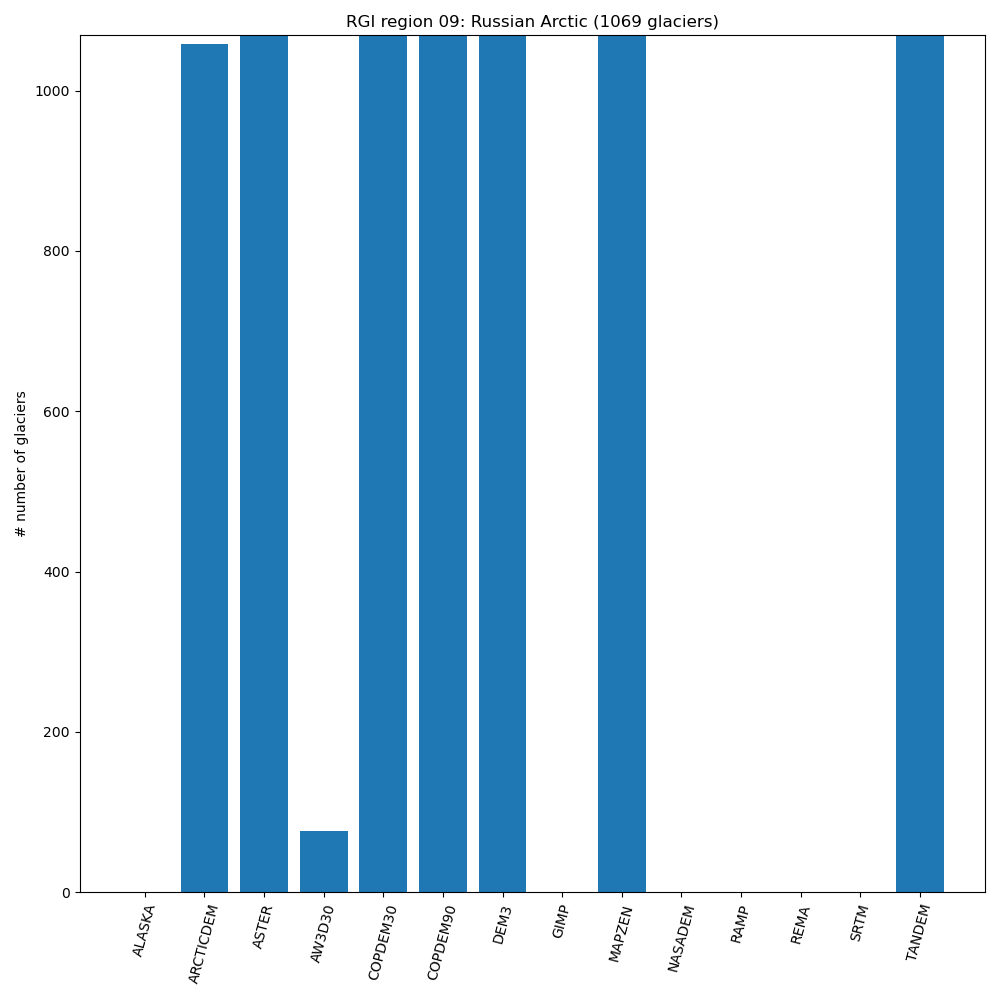
09 - Russian Arctic
RGI region |
# total |
ALASKA |
ARCTICDEM |
ASTER |
AW3D30 |
COPDEM30 |
COPDEM90 |
DEM3 |
GIMP |
MAPZEN |
NASADEM |
RAMP |
REMA |
SRTM |
TANDEM |
09-01: Franz Josef Land |
412 |
– |
100% |
99% |
– |
99% |
99% |
100% |
– |
100% |
– |
– |
– |
– |
100% |
09-02: Novaya Zemlya |
480 |
– |
97% |
100% |
14% |
100% |
100% |
100% |
– |
100% |
– |
– |
– |
– |
100% |
09-03: Severnaya Zemlya |
177 |
– |
99% |
100% |
3% |
100% |
100% |
99% |
– |
100% |
– |
– |
– |
– |
100% |
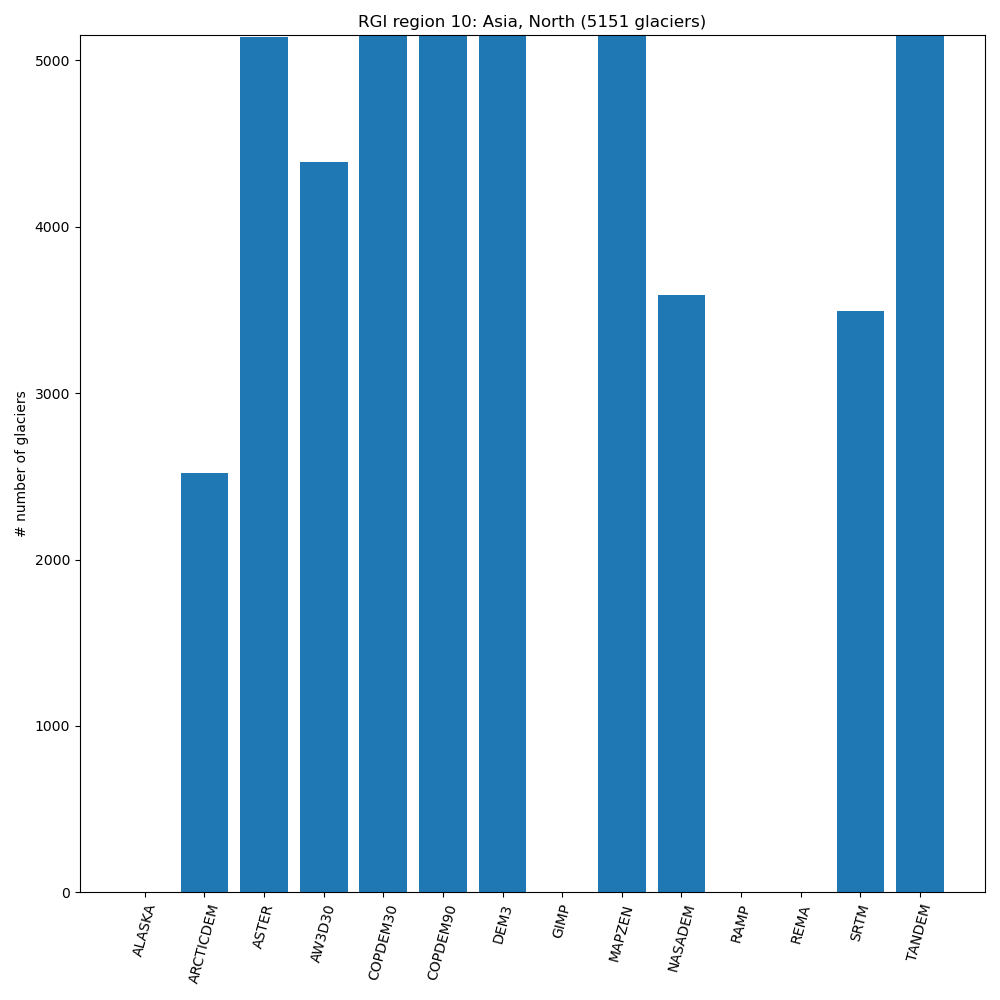
10 - Asia, North
RGI region |
# total |
ALASKA |
ARCTICDEM |
ASTER |
AW3D30 |
COPDEM30 |
COPDEM90 |
DEM3 |
GIMP |
MAPZEN |
NASADEM |
RAMP |
REMA |
SRTM |
TANDEM |
10-01: Ural Mountains |
161 |
– |
88% |
100% |
53% |
100% |
100% |
100% |
– |
100% |
– |
– |
– |
– |
100% |
10-02: Central Siberia |
394 |
– |
80% |
100% |
61% |
100% |
100% |
100% |
– |
100% |
19% |
– |
– |
19% |
100% |
10-03: Cherskiy/Suntar Khayata Ranges |
426 |
– |
91% |
99% |
61% |
99% |
99% |
99% |
– |
100% |
– |
– |
– |
– |
100% |
10-04: Altay and Sayan |
2437 |
– |
– |
100% |
100% |
100% |
100% |
100% |
– |
100% |
100% |
– |
– |
100% |
100% |
10-05: NE Russia |
1660 |
– |
96% |
99% |
79% |
99% |
99% |
99% |
– |
99% |
65% |
– |
– |
59% |
100% |
10-06: E Chukotka |
73 |
– |
97% |
100% |
60% |
100% |
100% |
100% |
– |
100% |
– |
– |
– |
– |
100% |
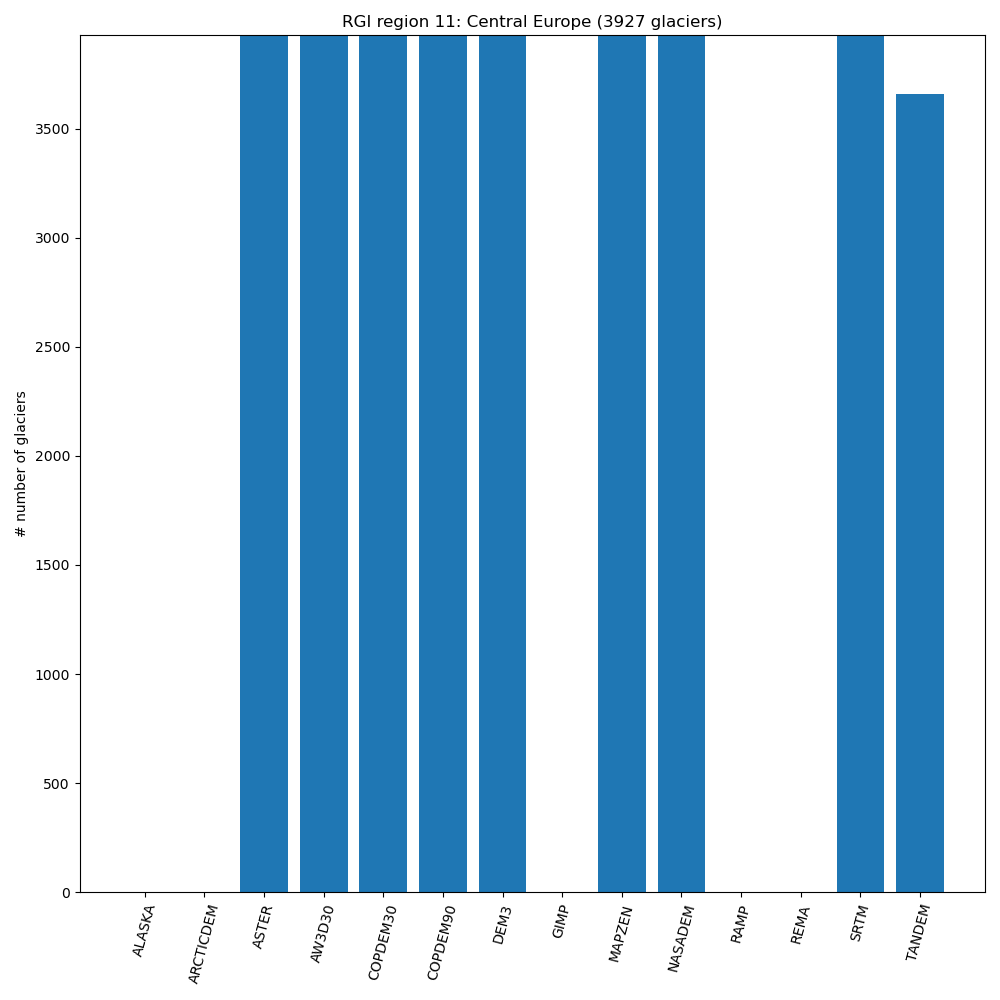
11 - Central Europe
RGI region |
# total |
ALASKA |
ARCTICDEM |
ASTER |
AW3D30 |
COPDEM30 |
COPDEM90 |
DEM3 |
GIMP |
MAPZEN |
NASADEM |
RAMP |
REMA |
SRTM |
TANDEM |
11-01: Alps |
3892 |
– |
– |
100% |
100% |
99% |
100% |
100% |
– |
100% |
100% |
– |
– |
100% |
93% |
11-02: Southern and Eastern Europe |
35 |
– |
– |
100% |
100% |
100% |
100% |
100% |
– |
100% |
100% |
– |
– |
100% |
100% |
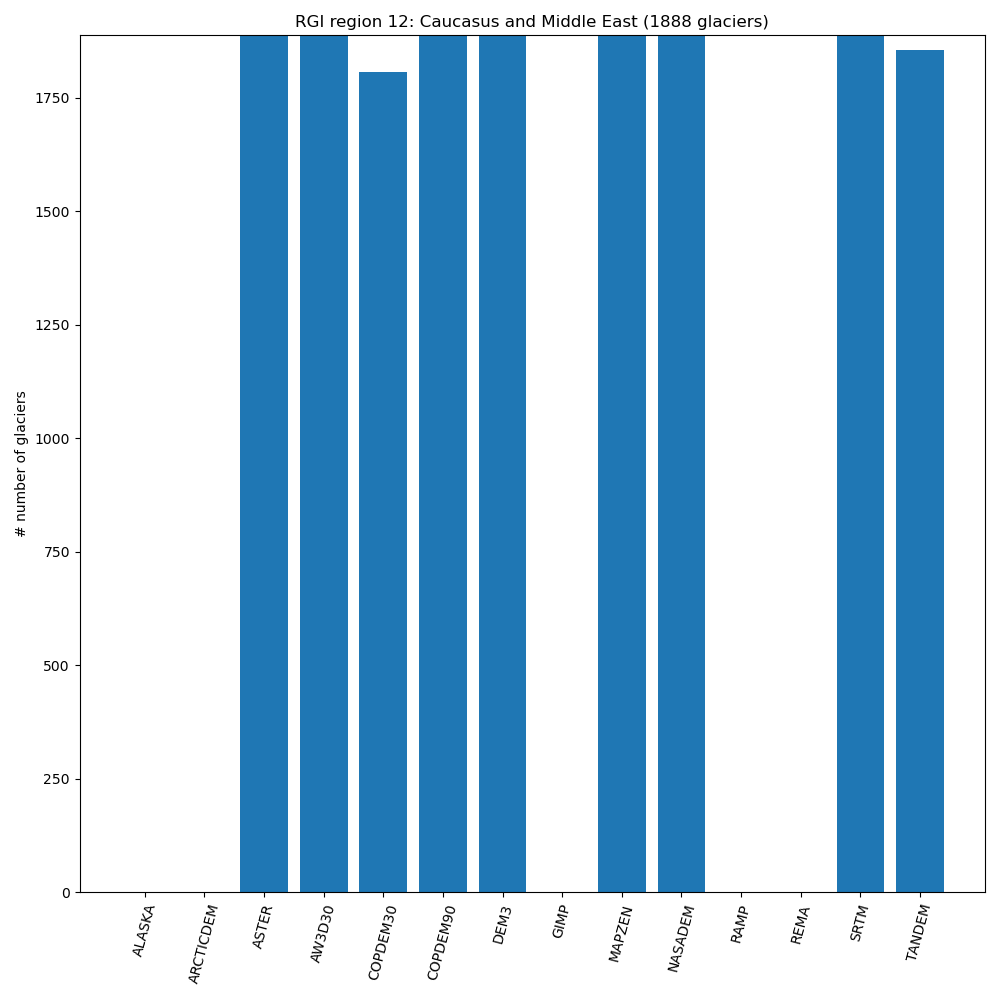
12 - Caucasus and Middle East
RGI region |
# total |
ALASKA |
ARCTICDEM |
ASTER |
AW3D30 |
COPDEM30 |
COPDEM90 |
DEM3 |
GIMP |
MAPZEN |
NASADEM |
RAMP |
REMA |
SRTM |
TANDEM |
12-01: Caucasus and Middle East |
1637 |
– |
– |
100% |
100% |
95% |
100% |
100% |
– |
100% |
100% |
– |
– |
100% |
98% |
12-02: Middle East |
251 |
– |
– |
100% |
100% |
97% |
100% |
100% |
– |
100% |
100% |
– |
– |
100% |
96% |
13 - Asia, Central
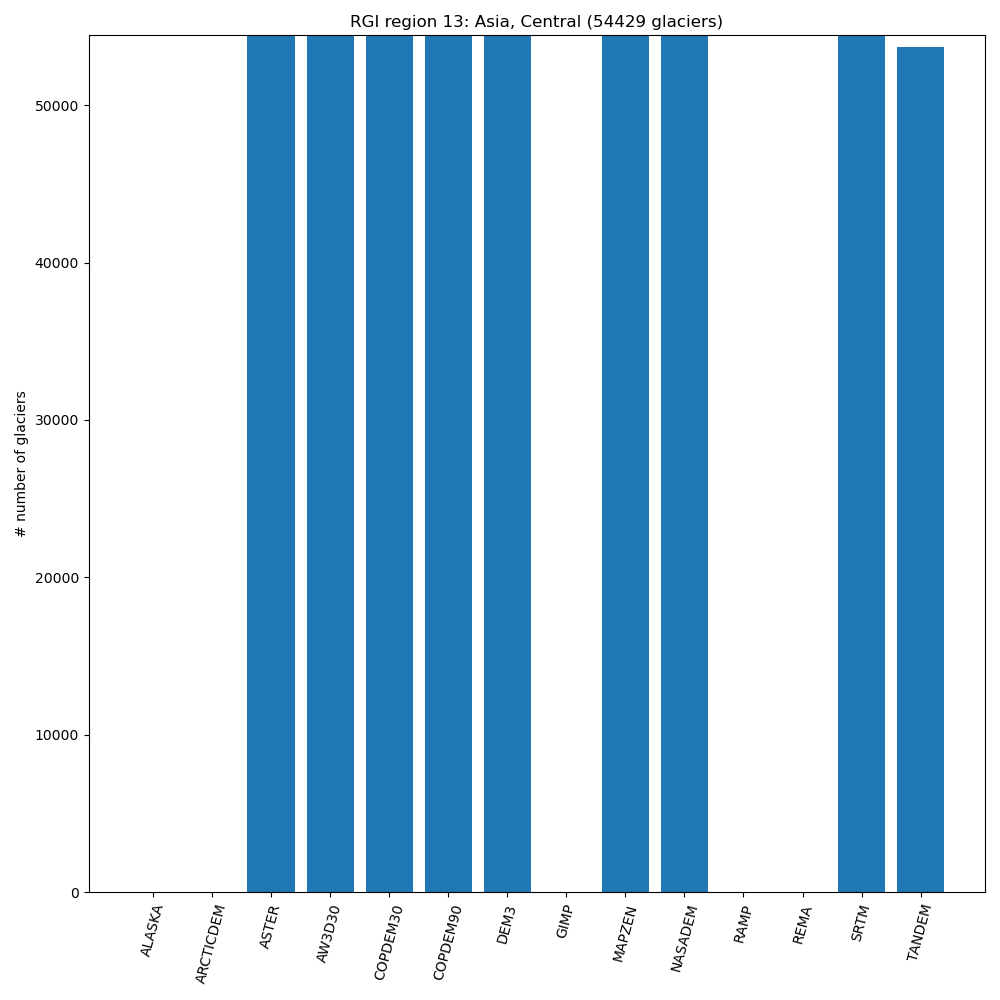
RGI region |
# total |
ALASKA |
ARCTICDEM |
ASTER |
AW3D30 |
COPDEM30 |
COPDEM90 |
DEM3 |
GIMP |
MAPZEN |
NASADEM |
RAMP |
REMA |
SRTM |
TANDEM |
13-01: Hissar Alay |
3151 |
– |
– |
100% |
100% |
100% |
100% |
100% |
– |
100% |
100% |
– |
– |
100% |
98% |
13-02: Pamir (Safed Khirs/W Tarim) |
10233 |
– |
– |
100% |
100% |
100% |
100% |
100% |
– |
100% |
100% |
– |
– |
100% |
98% |
13-03: W Tien Shan |
9739 |
– |
– |
100% |
100% |
100% |
100% |
100% |
– |
100% |
100% |
– |
– |
100% |
97% |
13-04: E Tien Shan (Dzhungaria) |
5227 |
– |
– |
100% |
100% |
100% |
100% |
100% |
– |
100% |
100% |
– |
– |
100% |
99% |
13-05: W Kun Lun |
5397 |
– |
– |
100% |
100% |
100% |
100% |
100% |
– |
100% |
100% |
– |
– |
100% |
99% |
13-06: E Kun Lun (Altyn Tagh) |
3519 |
– |
– |
100% |
100% |
100% |
100% |
100% |
– |
100% |
100% |
– |
– |
100% |
100% |
13-07: Qilian Shan |
2730 |
– |
– |
100% |
100% |
100% |
100% |
100% |
– |
100% |
100% |
– |
– |
100% |
100% |
13-08: Inner Tibet |
9368 |
– |
– |
100% |
100% |
100% |
100% |
100% |
– |
100% |
100% |
– |
– |
100% |
100% |
13-09: S and E Tibet |
5065 |
– |
– |
100% |
100% |
100% |
100% |
100% |
– |
100% |
100% |
– |
– |
100% |
96% |
14 - Asia, South West
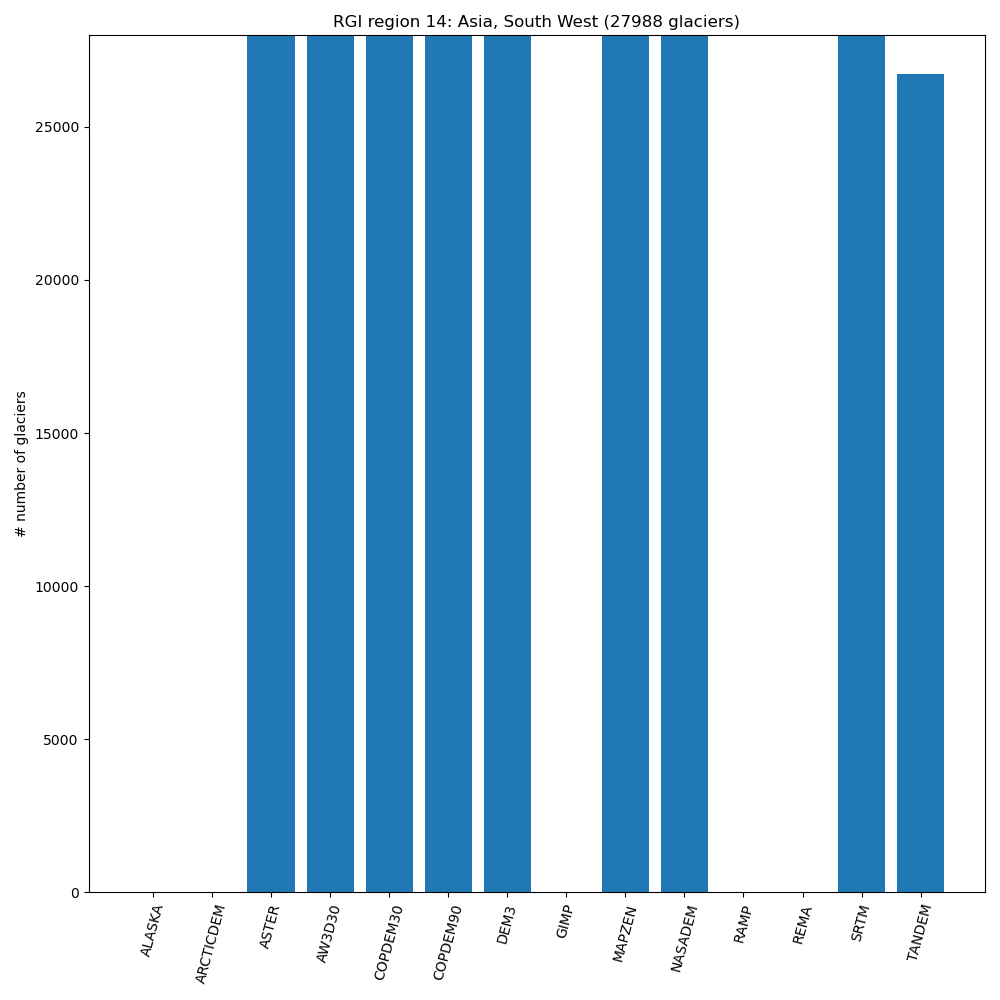
RGI region |
# total |
ALASKA |
ARCTICDEM |
ASTER |
AW3D30 |
COPDEM30 |
COPDEM90 |
DEM3 |
GIMP |
MAPZEN |
NASADEM |
RAMP |
REMA |
SRTM |
TANDEM |
14-01: Hindu Kush |
4401 |
– |
– |
100% |
100% |
100% |
100% |
100% |
– |
100% |
100% |
– |
– |
100% |
95% |
14-02: Karakoram |
13757 |
– |
– |
100% |
100% |
100% |
100% |
100% |
– |
100% |
100% |
– |
– |
100% |
94% |
14-03: W Himalaya |
9830 |
– |
– |
100% |
100% |
100% |
100% |
100% |
– |
100% |
100% |
– |
– |
100% |
97% |
15 - Asia, South East

RGI region |
# total |
ALASKA |
ARCTICDEM |
ASTER |
AW3D30 |
COPDEM30 |
COPDEM90 |
DEM3 |
GIMP |
MAPZEN |
NASADEM |
RAMP |
REMA |
SRTM |
TANDEM |
15-01: C Himalaya |
4528 |
– |
– |
100% |
100% |
100% |
100% |
100% |
– |
100% |
100% |
– |
– |
100% |
91% |
15-02: E Himalaya |
4238 |
– |
– |
100% |
100% |
100% |
100% |
100% |
– |
100% |
100% |
– |
– |
100% |
97% |
15-03: Hengduan Shan |
4353 |
– |
– |
100% |
100% |
100% |
100% |
100% |
– |
100% |
100% |
– |
– |
100% |
94% |
16 - Low Latitudes
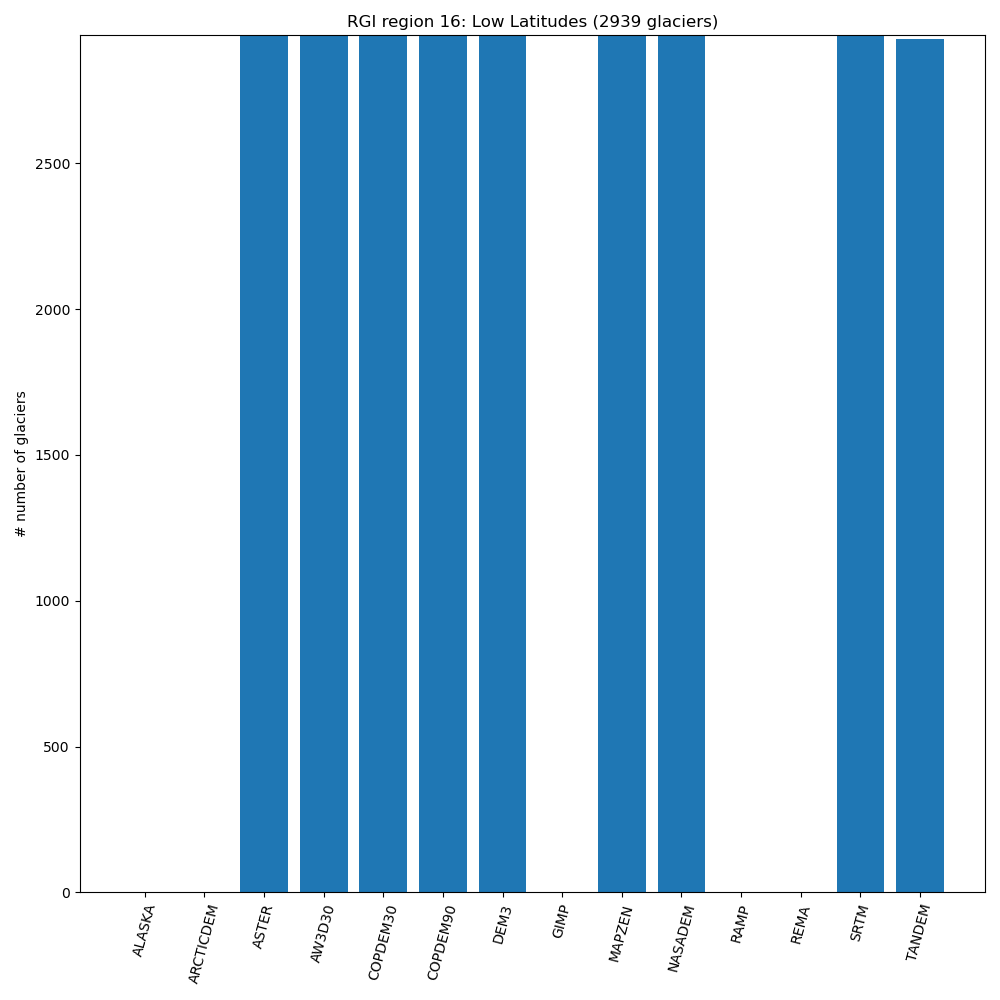
RGI region |
# total |
ALASKA |
ARCTICDEM |
ASTER |
AW3D30 |
COPDEM30 |
COPDEM90 |
DEM3 |
GIMP |
MAPZEN |
NASADEM |
RAMP |
REMA |
SRTM |
TANDEM |
16-01: Low-latitude Andes |
2891 |
– |
– |
100% |
100% |
100% |
100% |
100% |
– |
100% |
100% |
– |
– |
100% |
99% |
16-02: Mexico |
7 |
– |
– |
100% |
100% |
100% |
100% |
100% |
– |
100% |
100% |
– |
– |
100% |
100% |
16-03: E Africa |
36 |
– |
– |
100% |
100% |
100% |
100% |
100% |
– |
100% |
100% |
– |
– |
100% |
100% |
16-04: New Guinea |
5 |
– |
– |
100% |
100% |
100% |
100% |
100% |
– |
100% |
100% |
– |
– |
100% |
100% |
17 - Southern Andes

RGI region |
# total |
ALASKA |
ARCTICDEM |
ASTER |
AW3D30 |
COPDEM30 |
COPDEM90 |
DEM3 |
GIMP |
MAPZEN |
NASADEM |
RAMP |
REMA |
SRTM |
TANDEM |
17-01: Patagonia |
9434 |
– |
– |
99% |
99% |
99% |
99% |
99% |
– |
100% |
99% |
– |
– |
99% |
99% |
17-02: C Andes |
6474 |
– |
– |
100% |
100% |
100% |
100% |
100% |
– |
100% |
100% |
– |
– |
100% |
98% |
18 - New Zealand
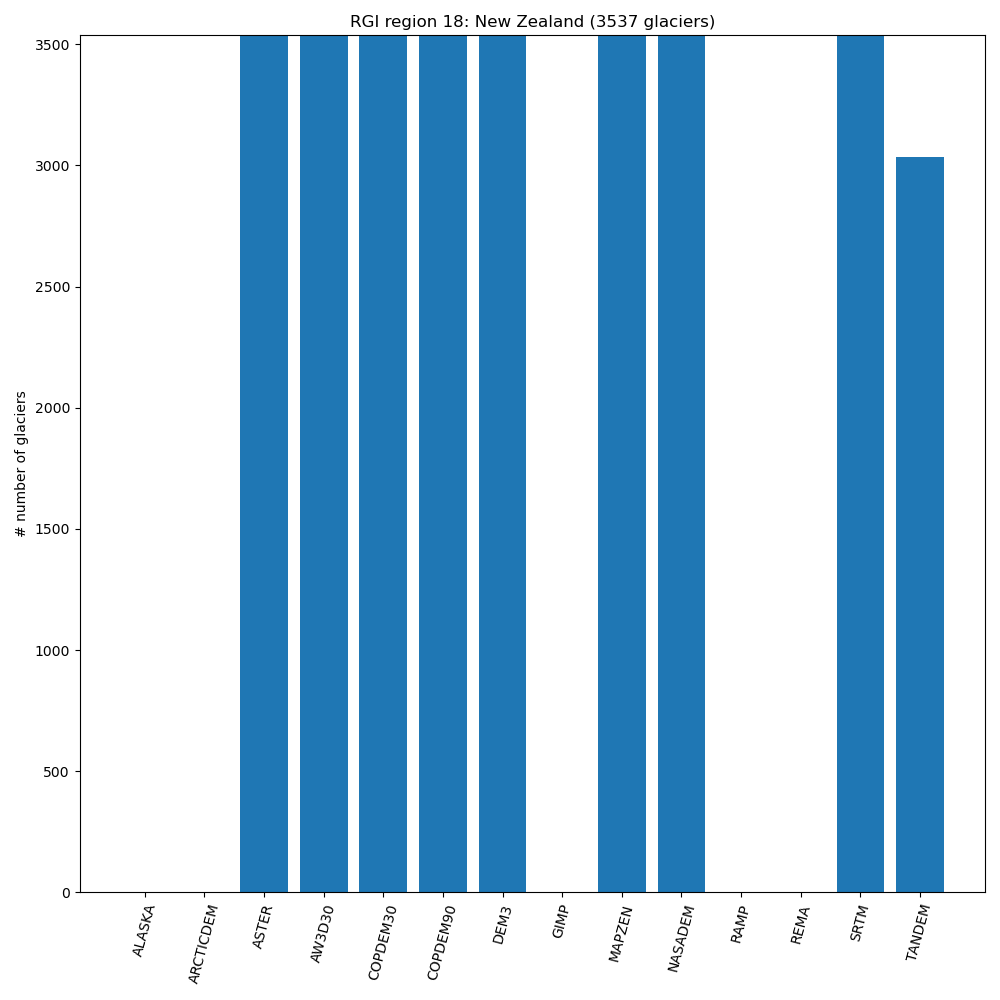
RGI region |
# total |
ALASKA |
ARCTICDEM |
ASTER |
AW3D30 |
COPDEM30 |
COPDEM90 |
DEM3 |
GIMP |
MAPZEN |
NASADEM |
RAMP |
REMA |
SRTM |
TANDEM |
18-01: New Zealand |
3537 |
– |
– |
100% |
100% |
100% |
100% |
100% |
– |
100% |
100% |
– |
– |
100% |
85% |
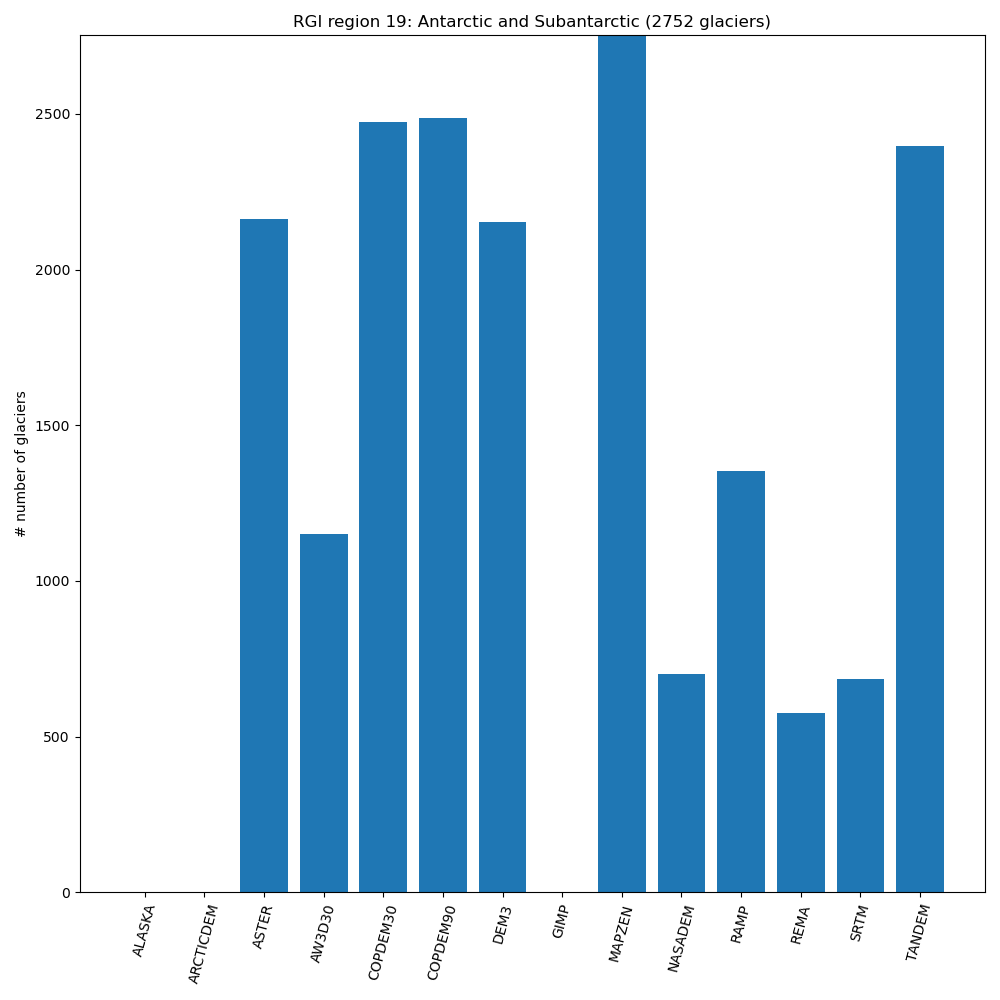
19 - Antarctic and Subantarctic
RGI region |
# total |
ALASKA |
ARCTICDEM |
ASTER |
AW3D30 |
COPDEM30 |
COPDEM90 |
DEM3 |
GIMP |
MAPZEN |
NASADEM |
RAMP |
REMA |
SRTM |
TANDEM |
19-01: Subantarctic (Pacific) |
27 |
– |
– |
96% |
– |
92% |
92% |
96% |
– |
100% |
– |
37% |
– |
– |
100% |
19-02: South Shetlands and South Orkney |
412 |
– |
– |
91% |
11% |
97% |
97% |
98% |
– |
100% |
– |
72% |
18% |
– |
51% |
19-03: Subantarctic (Atlantic) |
553 |
– |
– |
97% |
91% |
96% |
96% |
97% |
– |
100% |
94% |
– |
– |
92% |
92% |
19-04: Subantarctic (Indian) |
177 |
– |
– |
100% |
99% |
100% |
100% |
100% |
– |
100% |
100% |
– |
– |
98% |
98% |
19-05: Balleny Islands |
15 |
– |
– |
– |
– |
60% |
66% |
40% |
– |
93% |
– |
13% |
– |
– |
93% |
19-11: E Queen Maud Land 7A |
162 |
– |
– |
30% |
26% |
69% |
72% |
11% |
– |
100% |
– |
15% |
6% |
– |
100% |
19-12: Amery Ice Shelf 7B |
1 |
– |
– |
100% |
– |
100% |
100% |
100% |
– |
100% |
– |
100% |
100% |
– |
100% |
19-13: Wilkes Land 7C |
73 |
– |
– |
27% |
34% |
94% |
94% |
63% |
– |
100% |
– |
65% |
21% |
– |
100% |
19-14: Victoria Land 7D |
70 |
– |
– |
22% |
31% |
87% |
85% |
41% |
– |
100% |
– |
42% |
15% |
– |
100% |
19-15: Ross Ice Shelf 7E |
121 |
– |
– |
96% |
93% |
100% |
100% |
96% |
– |
100% |
– |
96% |
75% |
– |
100% |
19-16: Marie Byrd Land 7F |
34 |
– |
– |
73% |
29% |
88% |
88% |
94% |
– |
97% |
– |
94% |
52% |
– |
100% |
19-17: Pine Island Bay 7G |
109 |
– |
– |
11% |
5% |
23% |
26% |
6% |
– |
100% |
– |
18% |
1% |
– |
100% |
19-18: Bellingshausen Sea 7H1 |
20 |
– |
– |
90% |
30% |
90% |
90% |
85% |
– |
100% |
– |
95% |
55% |
– |
100% |
19-19: Alexander Island 7H2 |
123 |
– |
– |
76% |
20% |
91% |
91% |
88% |
– |
100% |
– |
91% |
48% |
– |
100% |
19-20: W Antarctic Pena 7I1 |
667 |
– |
– |
78% |
15% |
88% |
89% |
66% |
– |
100% |
– |
68% |
23% |
– |
83% |
19-21: NE Antarctic Pena 7I2 |
169 |
– |
– |
94% |
37% |
99% |
99% |
94% |
– |
100% |
– |
94% |
68% |
– |
98% |
19-22: SE Antarctic Pena 7I3 |
5 |
– |
– |
80% |
– |
100% |
100% |
100% |
– |
100% |
– |
100% |
– |
– |
100% |
19-24: W Queen Maud Land 7K |
14 |
– |
– |
28% |
7% |
100% |
100% |
100% |
– |
100% |
– |
100% |
50% |
– |
100% |