Tools
The examples below make use of the tools available in rgitools.funcs,
applying them to a subset of the RGI region 06, Iceland.
Data quality check
rgitools.funcs.check_geometries loops over each glacier and makes to
data quality checks:
MultiPolygons
A glacier geometry should be of type Polygon. If not, it is usually a MultiPolygon. In this case the tool makes a new check:
a MultiPolygon could be a list of the outline and one or more nunataks. In this case, the geometry is corrected to a valid Polygon with interior geometries. This was the case for all glaciers in RGIV4 but does not seem to happen since RGIV5
a MultiPolygon results from self intersecting glacier geometries (e.g. a geometry in the form of the number “8”. In theory, this should result in two separate glacier entities. In practice, this happens for few glaciers, and often one part of the “8” is very small: the tool will cut these out and raise an error if the geometry that was cut is too large.
Invalid geometries
Some geometries might be invalid in the sense of standards defined by the Open Geospatial Consortium. When possible, the tool corrects these geometries using the geom.buffer(0) method provided by shapely.
The function is simple to use. The output shapefile contains a new column
(check_geom) which contains information on the provided check. If empty,
it means that no correctino was applied. If not, a message tells you what
happened:
In [1]: import geopandas as gpd

In [2]: from rgitools.funcs import get_demo_file, check_geometries

In [3]: df = gpd.read_file(get_demo_file('RGI6_icecap.shp'))

In [4]: df = check_geometries(df)

In [5]: df.loc[df.check_geom != ''][['RGIId', 'check_geom']]
Out[5]:
             RGIId        check_geom
15  RGI60-06.00328  WARN:WasInvalid;
WARN:WasInvalid means that the geometry was invalid but is now corrected.
Glacier intersects
The RGI doesn’t provide information on where a glacier entity has
neighbors and which glaciers are connected. This is what the
rgitools.funcs.compute_intersects function is for:
In [6]: import matplotlib.pyplot as plt

In [7]: from rgitools.funcs import compute_intersects

In [8]: dfi = compute_intersects(df)

In [9]: f, ax = plt.subplots(figsize=(6, 4))

In [10]: df.plot(ax=ax, edgecolor='k');

In [11]: dfi.plot(ax=ax, edgecolor='C3'); plt.tight_layout();
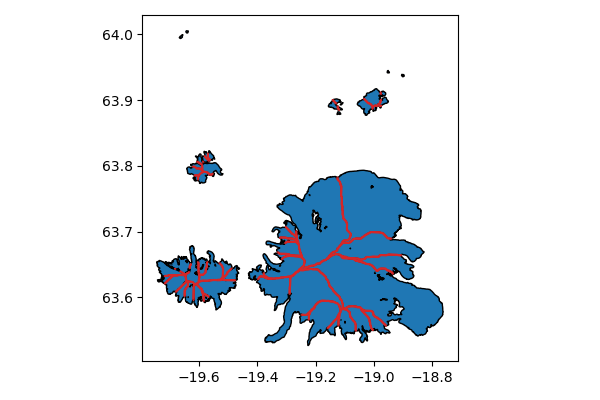
The intersects shapefile contains the divide geometries (in red on the plot) and the ID of the two glaciers it is the divide for:
In [12]: dfi.iloc[:5][['RGIId_1', 'RGIId_2']]
Out[12]:
          RGIId_1         RGIId_2
0  RGI60-06.00313  RGI60-06.00316
1  RGI60-06.00313  RGI60-06.00326
2  RGI60-06.00313  RGI60-06.00321
3  RGI60-06.00313  RGI60-06.00314
4  RGI60-06.00313  RGI60-06.00317
This information is then used by the rgitools.funcs.find_clusters function
to detect the connected entities:
In [13]: from rgitools.funcs import find_clusters

In [14]: clusters = find_clusters(dfi)

In [15]: df['cluster_id'] = 0

In [16]: for i, (k, c) in enumerate(clusters.items()):
   ....:     df.loc[df.RGIId.isin(c), 'cluster_id'] = i+1
   ....:

In [17]: f, ax = plt.subplots(figsize=(6, 4))

In [18]: df.plot(ax=ax, column='cluster_id', edgecolor='k', cmap='Set2'); plt.tight_layout();
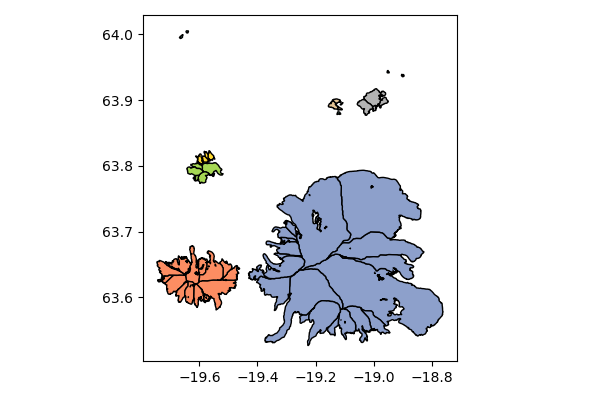
This function returns a dictionary containg the list of identifiers for each cluster.
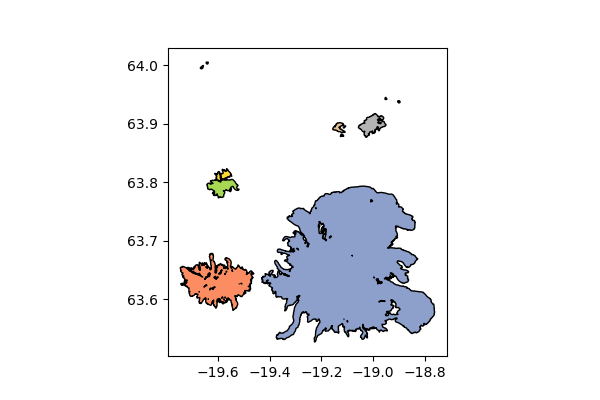
Merging glacier clusters
If needed, you can merge each of these clusters into a single polygon:
In [19]: from rgitools.funcs import merge_clusters

In [20]: df_merged = merge_clusters(df, dfi)

In [21]: f, ax = plt.subplots(figsize=(6, 4))

In [22]: df_merged.plot(ax=ax, column='cluster_id', edgecolor='k', cmap='Set2');
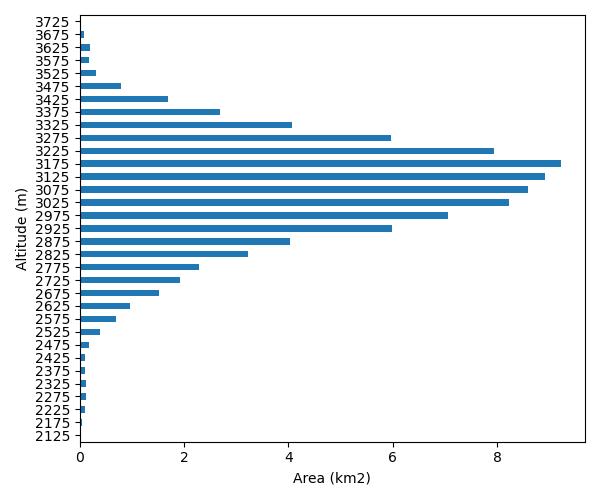
Glacier hypsometry
Based on freely available topography data and automated download scripts from the OGGM model, rgitools provides an automated script to compute glacier hypsometry in the same format as the RGI.
The data sources used by rgitools are listed here.
In [23]: rgi_df = gpd.read_file(get_demo_file('rgi_oetztal.shp'))

In [24]: def set_params(cfg):
   ....:     cfg.PATHS['dem_file'] = get_demo_file('srtm_oetztal.tif')
   ....:     cfg.PARAMS['use_multiprocessing'] = False
   ....:     return
   ....:

In [25]: from rgitools.funcs import hypsometries

In [26]: df, h_rgi_df = hypsometries(rgi_df, set_oggm_params=set_params)

In [27]: hypso_df = df[df.columns[3:]]

In [28]: hypso_df = (hypso_df / 1000).multiply(df['Area'], axis=0) # to area bands

In [29]: f, ax = plt.subplots(figsize=(6, 5))

In [30]: hypso_df.sum().plot.barh(ax=ax, color='C0');

In [31]: ax.set_xlabel('Area (km2)'); ax.set_ylabel('Altitude (m)'); plt.tight_layout();
More tools
More tools are coming soon! Stay tuned…
Software versions
In [32]: import rgitools

In [33]: import oggm

In [34]: import matplotlib

In [35]: import geopandas

In [36]: rgitools.__version__
Out[36]: '0.0.1-39-gba52f64'

In [37]: oggm.__version__
Out[37]: '1.5.3'

In [38]: matplotlib.__version__
Out[38]: '3.5.2'

In [39]: geopandas.__version__
Out[39]: '0.11.0'