The RGI-TOPO dataset (beta release)
RGI-TOPO provides a local topography map for each single glacier in the RGI.
We gathered and processed topography data for each glacier in the RGI V6 and for each Data sources we are aware of. These data are released in a beta version and are provided here for feedback and testing purposes only, i.e. they are not (yet) an official RGI product. In particular, the various topography data are provided “as is”, i.e. without recommendation on which data source to use. Note also that RGI-TOPO cannot be used for glacier change assessment: its aim is to provide a baseline for glacier modelling and other data analysis efforts.
Please help us to finalize this product! How to provide feedback will tell you how.
Note
We will include the final topography and hypsometry data in the next official RGI release (V7) scheduled for release by end of 2020.
Data download
We processed the data at two different resolutions. The default version is available at https://cluster.klima.uni-bremen.de/data/gdirs/dems_v1/default/RGI62/b_010/L1/. And a version with higher spatial resolution is available at https://cluster.klima.uni-bremen.de/data/gdirs/dems_v1/highres/RGI62/b_020/L1/
New in June 2022: a new version for RGI6 (dems_v2) is available at https://cluster.klima.uni-bremen.de/data/gdirs/dems_v2/default/RGI62/b_010/L1/. This preprocessed data includes the recently released Copernicus DEM GLO-30.
See Data format for details on file content, processing and resolution. And carefully read How to cite these data to find information on the original data sources and how to acknowledge them.
Data sources
For most regions several data sources are available, each with various acquisition dates and data quality issues. Until recently there was no gap-free, global DEM available. This might have changed with the release of Copernicus DEM GLO-90 which so far shows no artifacts and a very good global coverage: All but 284 RGI v6 glaciers are covered by Copernicus DEM. Unfortunately 264 of these are located in the RGI region 19: Antarctic and Subantarctic which accounts for 10% of this region’s total glaciers. These are mostly situated on small islands which are either not covered by the DEM or the RGI outlines are slightly misaligned and placed in the ocean. But this needs further investigation. Another downside is that the acquisition date of Copernicus DEM (2010-2015) differs from the target year 2000 of the current and the upcoming RGI outlines.
As of today (Mar 27 2020), the data sources supported by OGGM/rgitools are:
the Shuttle Radar Topography Mission (SRTM) 90m Digital Elevation Database v4.1 freely available for all locations in the [60°S; 60°N] range. Date of acquisition: February 2000
the Greenland Mapping Project (GIMP) Digital Elevation Model covering Greenland (for RGI region 05). Date of acquisition: February 2003 - October 2009
the Radarsat Antarctic Mapping Project (RAMP) Digital Elevation Model, Version 2 covering the Antarctic continent (for RGI region 19 with the exception of the peripheral islands). Date of acquisition: 1940-1999 (mostly 1980s and 1990s)
the Advanced Spaceborne Thermal Emission and Reflection Radiometer (ASTER) ASTER Global Digital Elevation Model (GDEM) Version 3 (ASTGTM) covering the entire globe but with consequent artefacts (not tagged as invalid data). Date of acquisition: 2000 - 2013
the Viewfinder Panoramas DEM3 products, a global DEM based on various of the above listed sources, manually merged and corrected, sometimes from cartographical data. Date of acquisition: variable, depending on original source.
the TanDEM-X 90m DEM, newly released and covering the entire globe. Date of acquisition: December 2010 - January 2015
the Arctic DEM newly released in version 7 and covering the northern latitudes at various resolutions (we picked 100m for a start). Date of acquisition: 2007-2018
the REMA Antarctic DEM newly released and covering the Antarctic continent at various resolutions (we picked 100m for a start). Date of acquisition: 2009 - 2017 (mostly 2015-2016)
the ALOS World 3D - 30mx (AW3D30) global digital surface model from the Japanese space agency JAXA. Date of acquisition: 2006-2011
the AWS terrain tiles data hosted on Amazon Web Services and maintained by Mapzen. This is a bundle of various data-sources but very flexible in use. Date of acquisition: variable, depending on original source
the Copernicus DEM GLO-90 is a new global DEM based on WorldDEM and void filled using ASTER, SRTM, GMTED2010, TerraSAR-X and ALOS World 3D-30m. It is a European Space Agency Copernicus product and freely available at a 3 arc second resolution. Date of acquisition: 2010-2015
the Copernicus DEM GLO-30 - is similar to Copernicus DEM GLO-90 but at approximately 30m resolution (1 arc second). Date of acquisition: 2010-2015
the Alaska V3 DEM is a merged DEM product from SRTM, IFSAR DEM, SPOT observations of the SPIRIT program and ASTER with a final resolution of 30m. The DEM was created for and is provided by Kienholz et al., 2014. Date of acquisition: 2000-2011
the NASADEM is a merged DEM product with 1 arc second resolution and available between 60N and 56S. NASADEM is dereived from the original SRTM but postprocessed with updated algorithms and newer auxiliary data which were not around for the original SRTM processing. Date of acquisition: February 2000
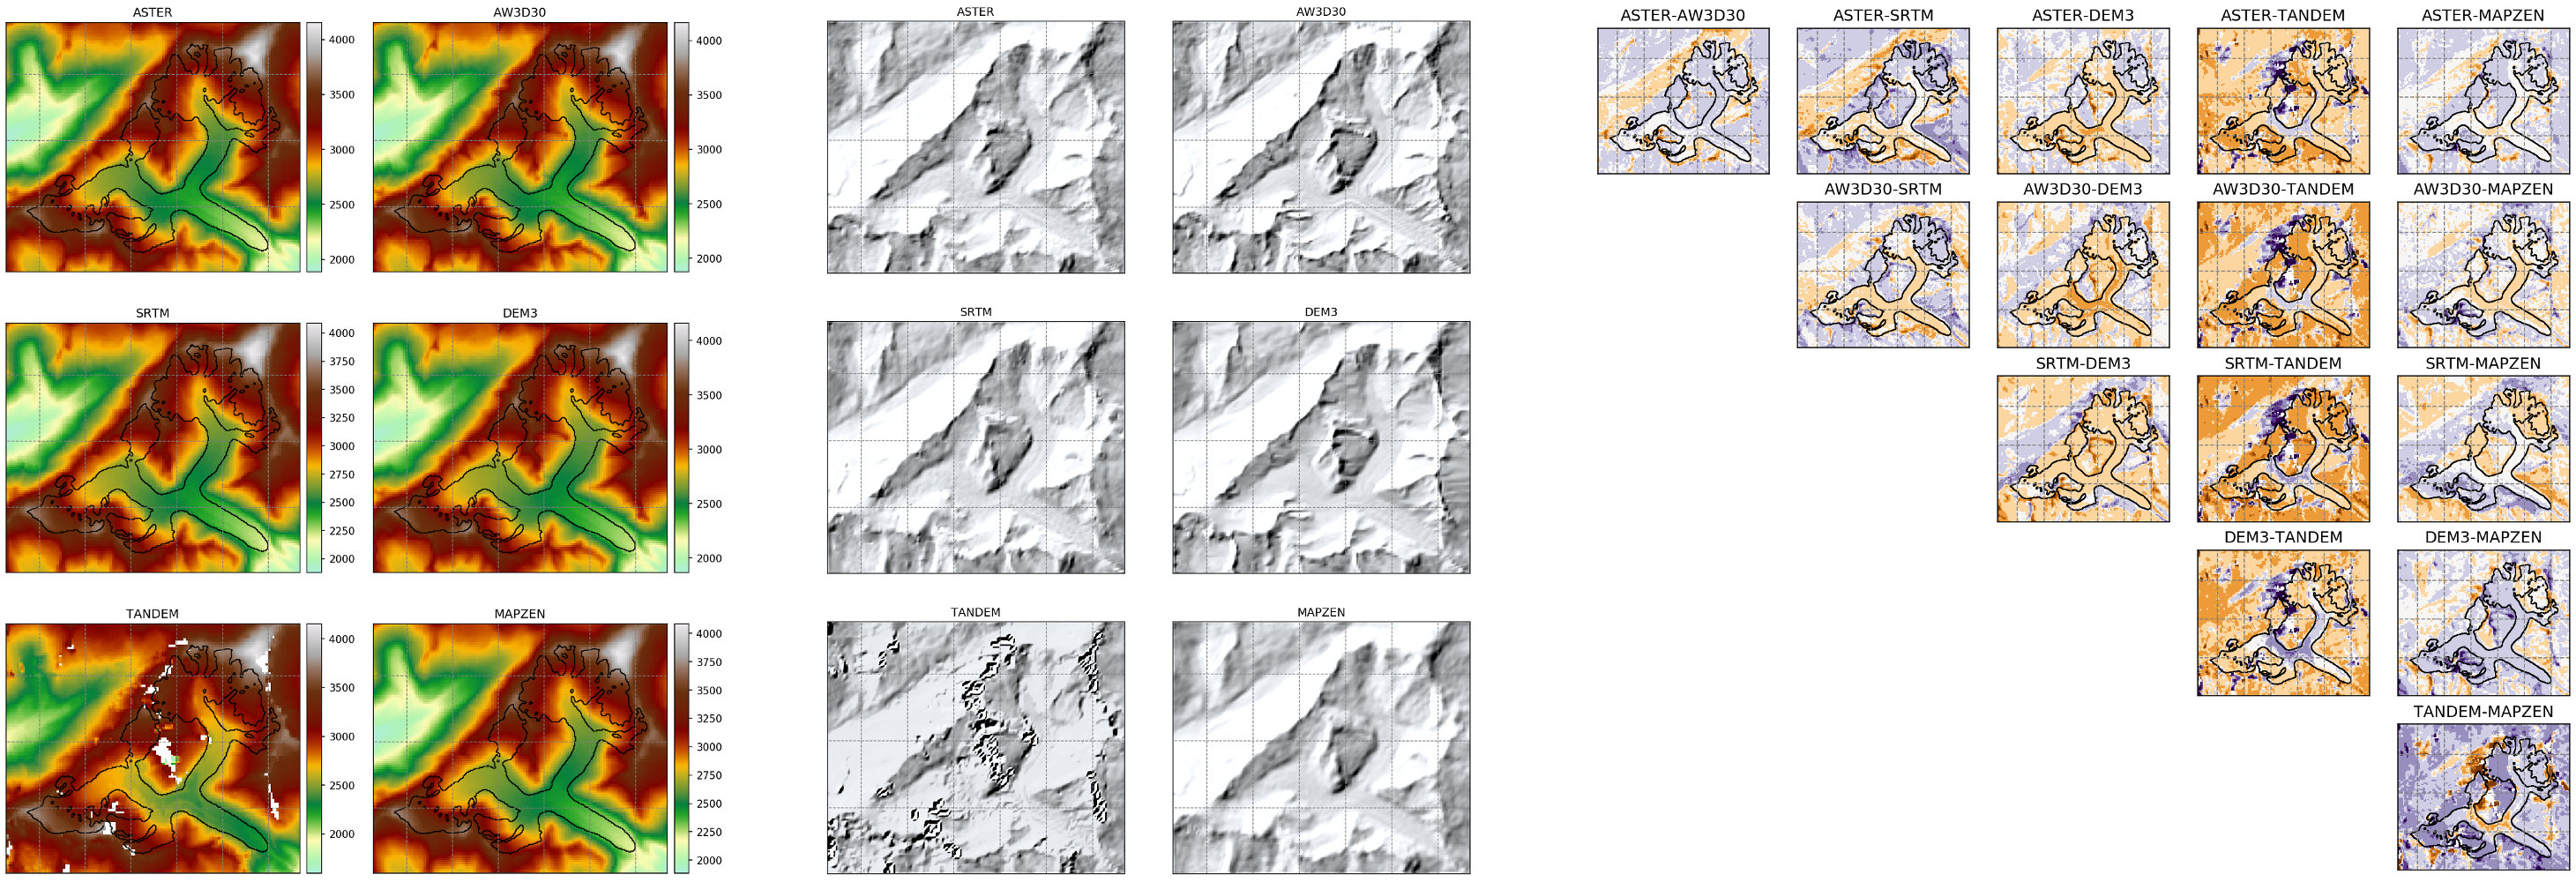
Examples
- Hintereisferner (Alps)
- Oberaletschgletscher (Alps)
- Columbia (Alaska)
- Dyngjujoekull (Iceland)
- Random ice-cap (Greenland)
- Devon ice-cap (Arctic Canada)
- Shallap (Peru)
- Nordenskjöld Glacier (S. Georgia)
- Alexander Island (Antarctica)
- Gillock Island (Antarctica)
- Balleny Islands (Antarctica)
- Pine Island Bay (Antarctica)
- Queen Maud Land (Antarctica)
- Dobbin Bay (Arctic Canada)
- Thana (Bhutan)
- Tellbreen (Svalbard)
- Nigardsbreen (Norway)
- Olivine Ice Plateau (NZ)
- Leningradskiy Ice Cap
These graphics and statistics were generated with a freely available Jupyter notebook. You can run this notebook online (without any installation) by following this link (the online server may take a couple of minutes to start).
Data format
The data is sorted into regional folders (one per RGI region). Each tar file stores 1000 glaciers (RGI60-01.00.tar contains glacier IDs from RGI60-01.00001 to RGI60-01.00999, RGI60-01.01.tar contains glacier IDs from RGI60-01.01000 to RGI60-01.01999, etc.).
Each glacier data comes in a single folder named after its RGI ID. A glacier folder contains the following data files:
glacier_mask.tif: a raster mask of the RGI glacier at the same resolution than the associated DEMs (geotiff format).
outlines.tar.gz: the RGI vector outlines for this glacier
intersects.tar.gz: the vector lines of the boundaries between this glacier and possible neighbors
glacier_grid.json: information about the grid and map projection
diagnostics.json, log.txt: files used by OGGM/rgitools (not relevant here)
one folder per available DEM source, containing a dem.tif file (geotiff format) and the data source and citation information in dem_source.txt (text file).
The topography data is bilinearily interpolated from the DEM source to a local tranverse mercator map projection (similar to the well known UTM, but with projection parameters centered on the glacier). Most modern GIS packages are able to read the projection information out of the geotiff files.
The spatial resolution of the target local grid depends on the size of the glacier. We use a square relation to the glacier size (\(dx=aS^{\frac{1}{2}}\), with S the area of the glacier in \(\text{km}^{2}\)). The parameter a is set to 14 in the default and 7 in the higher resolution data set. The resulting dx is clipped to minimum of 10m in both versions. The maximum of dx is clipped to 200m in the default and 100m in the higher resolution version.
The map size is chosen so that it is larger than the glacier of about 10 grid points (20 in the higher resolution version to give approximately the same extents). A future release of the data will also ship with larger map extents.
How to cite these data
Warning
IMPORTANT: RGI-TOPO does NOT generate any new topography data. We use freely available data and interpolate it to a local glacier map. If you make use of these data for a publication, presentation or website, it is mandatory to refer to the original data provider as given in the dem_source.txt file found in each DEM folder.
We are very thankful to the institutions providing these data, and we ask our users to acknowledge the original contributions according to their respective license (sometimes unclear, unfortunately).
RGI-TOPO itself (i.e., the compilation of data) is licensed under a CC BY 4.0 license, i.e. you can use, share and adapt it under the conditions stated by the license and by acknowledging the rgitools contributors as well as the original data sources (as explained above). The name of the rgitools contributors cannot be used to endorse any product or result derived from RGI-TOPO without prior approval.
Note
If you wish to acknowledge the data processing work that was necessary to generate these data in a scientific publication, we suggest the following citation: “The glacier dem data was processed with the rgitools and OGGM software packages (Maussion et al., 2019 doi: 10.5194/gmd-12-909-2019).”
How to provide feedback
Before the official release with the next RGI version, we aim to:
make sure that we didn’t miss any important data source
ensure that there is no bug in our processing chain, i.e. that the data is properly parsed, reprojected, and documented
decide on the data format which is most suitable for the majority of users
publish a detailed report about the quality and data availability of each data source
decide on a “standard” data source for each glacier, which will provide the reference hypsometry for future RGI versions
Your help on any of these objectives is very welcome! Contact us if you want to provide feedback.
Regarding the choice of the default data source for the RGI, we currently formulate the following criteria:
robust and gap-free datasets are preferred over more accurate or recent but incomplete DEMS. Indeed, we have to keep in mind that any kind of glacier bed inversion or glacier simulation based on ice-dynamics cannot deal with topographical artefacts.
the acquisition date of the DEM must be as close as possible to the acquisition date of the glacier outline (which is targeted to be around 2000 in RGI V7).
preferably, the DEM source should be the same for neighboring glaciers. This implies that ideally, a single DEM source should be chosen at the region or sub-region level.
Currently, we are most confident in SRTM for all latitudes between 60° N and S. Almost gap free, the SRTM data aquisition date is also very concordant with the target date of the RGI outlines.
For all other regions, more investigation is needed and your feedback is welcome.
Global data availability
The following section shows a more detailed analysis of all the above mentioned DEMs with respect to the different RGI regions.
Table 1 gives a summary for the RGI regions with respect to the different DEMs. For this and all further analysis a DEM is only attributed as available to a individual glacier if the glacier centered cutout has less than 10% missing data points in this DEM. This threshold obviously only covers actual voids in the DEM source but does not state anything about the quality or accuracy of the none-void data points.
RGI region |
# total |
ALASKA |
ARCTICDEM |
ASTER |
AW3D30 |
COPDEM30 |
COPDEM90 |
DEM3 |
GIMP |
MAPZEN |
NASADEM |
RAMP |
REMA |
SRTM |
TANDEM |
27108 |
100% |
75% |
100% |
76% |
100% |
100% |
100% |
– |
100% |
47% |
– |
– |
47% |
99% |
|
18855 |
17% |
4% |
100% |
94% |
100% |
100% |
100% |
– |
100% |
93% |
– |
– |
93% |
98% |
|
4556 |
– |
99% |
98% |
63% |
99% |
99% |
99% |
15% |
100% |
– |
– |
– |
– |
100% |
|
7415 |
– |
97% |
100% |
44% |
100% |
100% |
98% |
– |
100% |
1% |
– |
– |
1% |
100% |
|
19306 |
– |
95% |
98% |
71% |
99% |
99% |
99% |
100% |
99% |
– |
– |
– |
– |
99% |
|
568 |
– |
97% |
100% |
27% |
100% |
100% |
100% |
– |
100% |
– |
– |
– |
– |
100% |
|
1615 |
– |
99% |
100% |
32% |
100% |
100% |
100% |
– |
100% |
– |
– |
– |
– |
99% |
|
3417 |
– |
92% |
100% |
24% |
100% |
100% |
100% |
– |
100% |
8% |
– |
– |
2% |
100% |
|
1069 |
– |
98% |
99% |
7% |
99% |
99% |
99% |
– |
100% |
– |
– |
– |
– |
100% |
|
5151 |
– |
48% |
99% |
85% |
99% |
99% |
99% |
– |
99% |
69% |
– |
– |
67% |
100% |
|
3927 |
– |
– |
100% |
100% |
99% |
100% |
100% |
– |
100% |
100% |
– |
– |
100% |
93% |
|
1888 |
– |
– |
100% |
100% |
95% |
100% |
100% |
– |
100% |
100% |
– |
– |
100% |
98% |
|
54429 |
– |
– |
100% |
100% |
100% |
100% |
100% |
– |
100% |
100% |
– |
– |
100% |
98% |
|
27988 |
– |
– |
100% |
100% |
100% |
100% |
100% |
– |
100% |
100% |
– |
– |
100% |
95% |
|
13119 |
– |
– |
100% |
100% |
100% |
100% |
100% |
– |
100% |
100% |
– |
– |
100% |
94% |
|
2939 |
– |
– |
100% |
100% |
100% |
100% |
100% |
– |
100% |
100% |
– |
– |
100% |
99% |
|
15908 |
– |
– |
99% |
99% |
99% |
99% |
99% |
– |
100% |
99% |
– |
– |
99% |
98% |
|
3537 |
– |
– |
100% |
100% |
100% |
100% |
100% |
– |
100% |
100% |
– |
– |
100% |
85% |
|
2752 |
– |
– |
78% |
41% |
89% |
90% |
78% |
– |
99% |
25% |
49% |
20% |
24% |
87% |
|
All RGI regions |
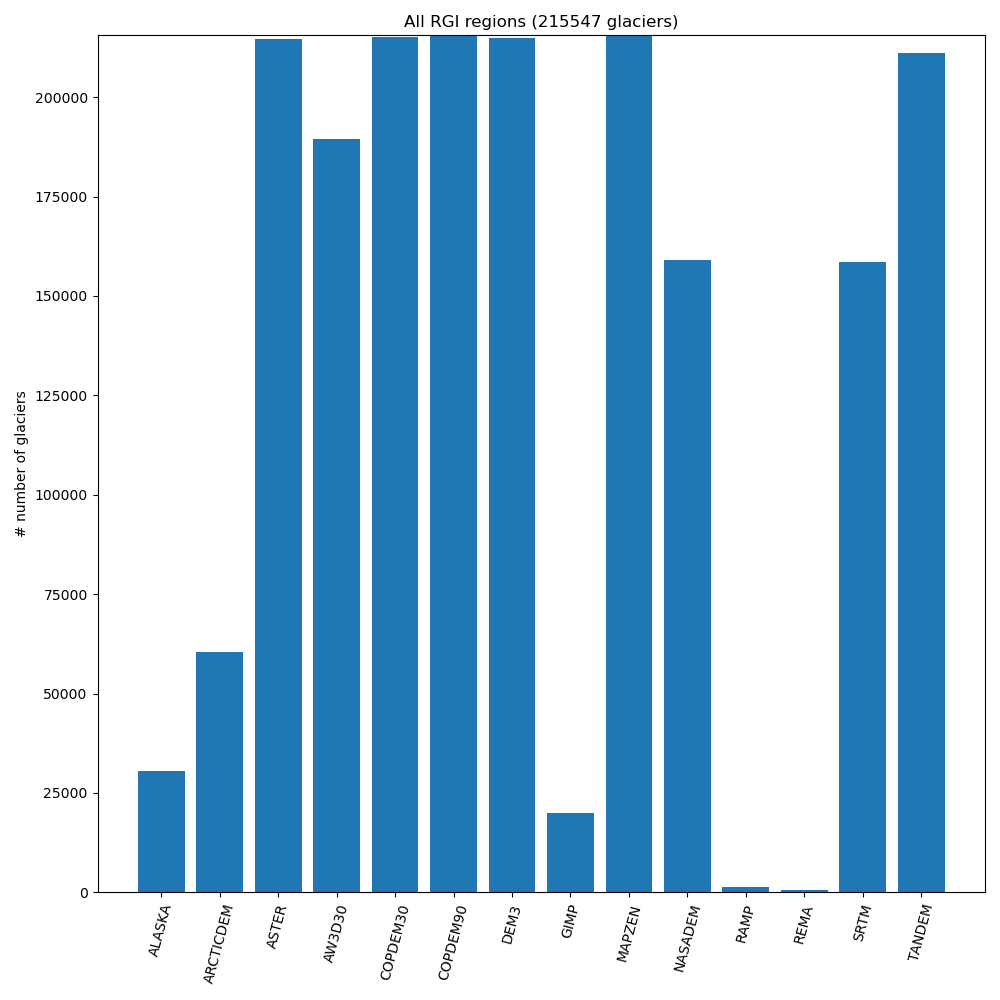
215547 |
14% |
28% |
99% |
87% |
99% |
99% |
99% |
9% |
99% |
73% |
– |
– |
73% |
97% |
The following barplot shows again the availability of particular DEMs for RGI region.
In the section Details for RGI subregions you can find similar statistics but broken down into the RGI Subregions.
Code availability
These data where generated with OGGM version 1.2. This tutorial (interactive version) documents how to create local topography maps yourselves.
Contact
RGI-TOPO authors: Matthias Dusch Alexander Fisher and Fabien Maussion.
For feedback, please use the github issue tracker (requires a github account) or send us an email.
Acknowledgements
We acknowledge financial support from the International Association of Cryospheric Sciences (Matthias Dusch) and from the University of Innsbruck (Fabien Maussion).